Give me a "t"
Standards:
8.SP.1: Construct and interpret scatter plots for bivariate measurement data to investigate patterns of association between two quantities. Describe patterns such as clustering, outliers, positive or negative association, linear association, and nonlinear association.
8.SP.2: Know that straight lines are widely used to model relationships between two quantitative variables. For scatter plots that suggest a linear association, informally fit a straight line, and informally assess the model fit by judging the closeness of the data points to the line.
8.SP.3: Use the equation of a linear model to solve problems in the context of bivariate measurement data, interpreting the slope and intercept.
8.SP. 4: Understand that patterns of association can also be seen in bivariate categorical data by displaying frequencies and relative frequencies in a two-way table. Construct and interpret a two-way table summarizing data on two categorical variables collected from the same subjects. Use relative frequencies calculated for rows or columns to describe possible association between the two variables.
1. Rewrite the standard in your own words. How does the assignment relate to the standard?
Rewritten Standards
8.SP.1: Create scatter plots for the measurements of data to indicate the patterns and relationships between two quantities. Describe patterns such as clustering, outliers, positive or negative association, linear association, and nonlinear association.
8.SP.2: Know that straight lines are often used to indicate and represent relationships between two quantitative variables. Scatter plots that have a linear line/function, a straight line, and determine how accurate the trend line is by seeing how close the coordinates are to the line.
8.SP.3: Use a linear function to solve problems in the context of data measurements,and finding the slope and intercepts.
8.SP. 4: Understand that patterns of relationships that can also be seen in organized data by displaying frequencies and relative frequencies in a two-way table. Create and interpret a two-way table and find the relationship with the data on two categorical variables collected from the same subjects. Use relative frequencies calculated for rows or columns to describe possible association between the two variables.
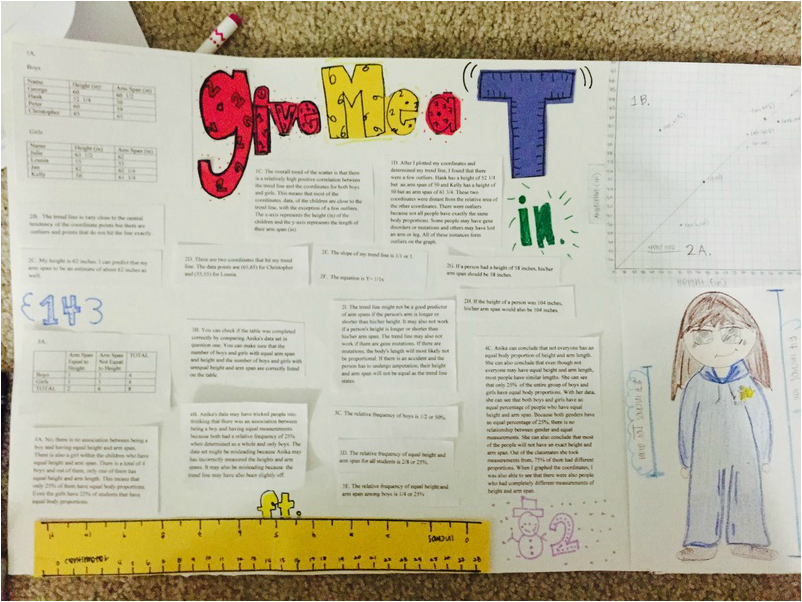
The assignment relates to the standard because all of the standards were different sections of the of the whole project. There was a section that required us to find the relationship of the given data set and graph it. After we graphed it, I was able to see the outliers and and the clusterings. I was able to determine the correlation of the coordinates and even find the trend line. After, I took the information and analyzed it. I found the relative frequency and then wrote about how there are circumstance where the data Anika collected may not work or not be accurate.
2. What steps did you take to complete the assignment?
In order to complete and do well on this assignment, I had to first use my time wisely. I was given time in class to work on it with my team members and ask questions if I needed to. I tried to get through most of the questions so that I wouldn't be struggling at home. Next, I went home and started to type up my responses. I wanted to make my project professional so I tried to make my poster organized. Because it was a project, I didn't want it to be only simple so I also started to make my project decorative. I tried to make my poster match the overall theme of the project so I decided to draw a person and label their height and arm span. I also created a ruler and decorated my poster with numbers and measurements.
3. This assignment demonstrates the following strengths...
The assignment demonstrates the strength of being able to properly manage and take advantage of time. We were given time in class to work together and ask questions. I finished all of the questions in class and asked many questions. It also demonstrates if I am able to take a set of numbers and relate them to something else. I was given a data set and had to make a graph. From there, I had to observe my findings and analyze them. I had to describe what could have gone wrong and when this data set wouldn't make sense. It also shows my sense of creativity because I had to be able to decorate my poster to the math task that was given.
4. I could have improved my work on this assignment by...
I could have improved my work on this assignment by spacing out the given time. Then, I could have had more time to type up my responses. I always have a hard time with procrastination but I know I am getting better. I could have also improved my work by being more creative with my poster. I know that if I put a little more thought, I would have been able to make a nicer looking poster. My poster was quite simple and not as creative as I originally wanted it to be. The main reason for this is lack of preparation so next time, I will start earlier and plan ahead.
5. How will you apply the skills you learned from this assignment in the real-world, as an adult or in other classes while you are still a student? Provide specific scenarios/examples.
I will apply the skill of time management through out my life but especially when i'm taking timed tests. I will be given a certain amount of time to answer questions and I will need them completed so I will have to pace myself. I will also use the skill of analyzing data and explaining it through words as I take more CC tests. Most the questions asked on Common Core require you to take it a step further and explain your findings as well as how you found that answer. I can use the skill of statistics in further math classes and as I take AP classes.
Rewritten Standards
8.SP.1: Create scatter plots for the measurements of data to indicate the patterns and relationships between two quantities. Describe patterns such as clustering, outliers, positive or negative association, linear association, and nonlinear association.
8.SP.2: Know that straight lines are often used to indicate and represent relationships between two quantitative variables. Scatter plots that have a linear line/function, a straight line, and determine how accurate the trend line is by seeing how close the coordinates are to the line.
8.SP.3: Use a linear function to solve problems in the context of data measurements,and finding the slope and intercepts.
8.SP. 4: Understand that patterns of relationships that can also be seen in organized data by displaying frequencies and relative frequencies in a two-way table. Create and interpret a two-way table and find the relationship with the data on two categorical variables collected from the same subjects. Use relative frequencies calculated for rows or columns to describe possible association between the two variables.
The assignment relates to the standard because all of the standards were different sections of the of the whole project. There was a section that required us to find the relationship of the given data set and graph it. After we graphed it, I was able to see the outliers and and the clusterings. I was able to determine the correlation of the coordinates and even find the trend line. After, I took the information and analyzed it. I found the relative frequency and then wrote about how there are circumstance where the data Anika collected may not work or not be accurate.
2. What steps did you take to complete the assignment?
In order to complete and do well on this assignment, I had to first use my time wisely. I was given time in class to work on it with my team members and ask questions if I needed to. I tried to get through most of the questions so that I wouldn't be struggling at home. Next, I went home and started to type up my responses. I wanted to make my project professional so I tried to make my poster organized. Because it was a project, I didn't want it to be only simple so I also started to make my project decorative. I tried to make my poster match the overall theme of the project so I decided to draw a person and label their height and arm span. I also created a ruler and decorated my poster with numbers and measurements.
3. This assignment demonstrates the following strengths...
The assignment demonstrates the strength of being able to properly manage and take advantage of time. We were given time in class to work together and ask questions. I finished all of the questions in class and asked many questions. It also demonstrates if I am able to take a set of numbers and relate them to something else. I was given a data set and had to make a graph. From there, I had to observe my findings and analyze them. I had to describe what could have gone wrong and when this data set wouldn't make sense. It also shows my sense of creativity because I had to be able to decorate my poster to the math task that was given.
4. I could have improved my work on this assignment by...
I could have improved my work on this assignment by spacing out the given time. Then, I could have had more time to type up my responses. I always have a hard time with procrastination but I know I am getting better. I could have also improved my work by being more creative with my poster. I know that if I put a little more thought, I would have been able to make a nicer looking poster. My poster was quite simple and not as creative as I originally wanted it to be. The main reason for this is lack of preparation so next time, I will start earlier and plan ahead.
5. How will you apply the skills you learned from this assignment in the real-world, as an adult or in other classes while you are still a student? Provide specific scenarios/examples.
I will apply the skill of time management through out my life but especially when i'm taking timed tests. I will be given a certain amount of time to answer questions and I will need them completed so I will have to pace myself. I will also use the skill of analyzing data and explaining it through words as I take more CC tests. Most the questions asked on Common Core require you to take it a step further and explain your findings as well as how you found that answer. I can use the skill of statistics in further math classes and as I take AP classes.
